Scientists have created a clearer image of the terrain buried beneath Antarctic ice, revealing hard valleys, channels and other features that were previously difficult to detect.
These hidden shapes are important because they control ice flow and influence how quickly ice reaches the ocean.

Being able to better see the ground beneath the ice could improve predictions of ice loss and narrow uncertainty. sea level rise prediction.
Helen Ockenden and colleagues University of Edinburgh We have created a new continent-wide map.
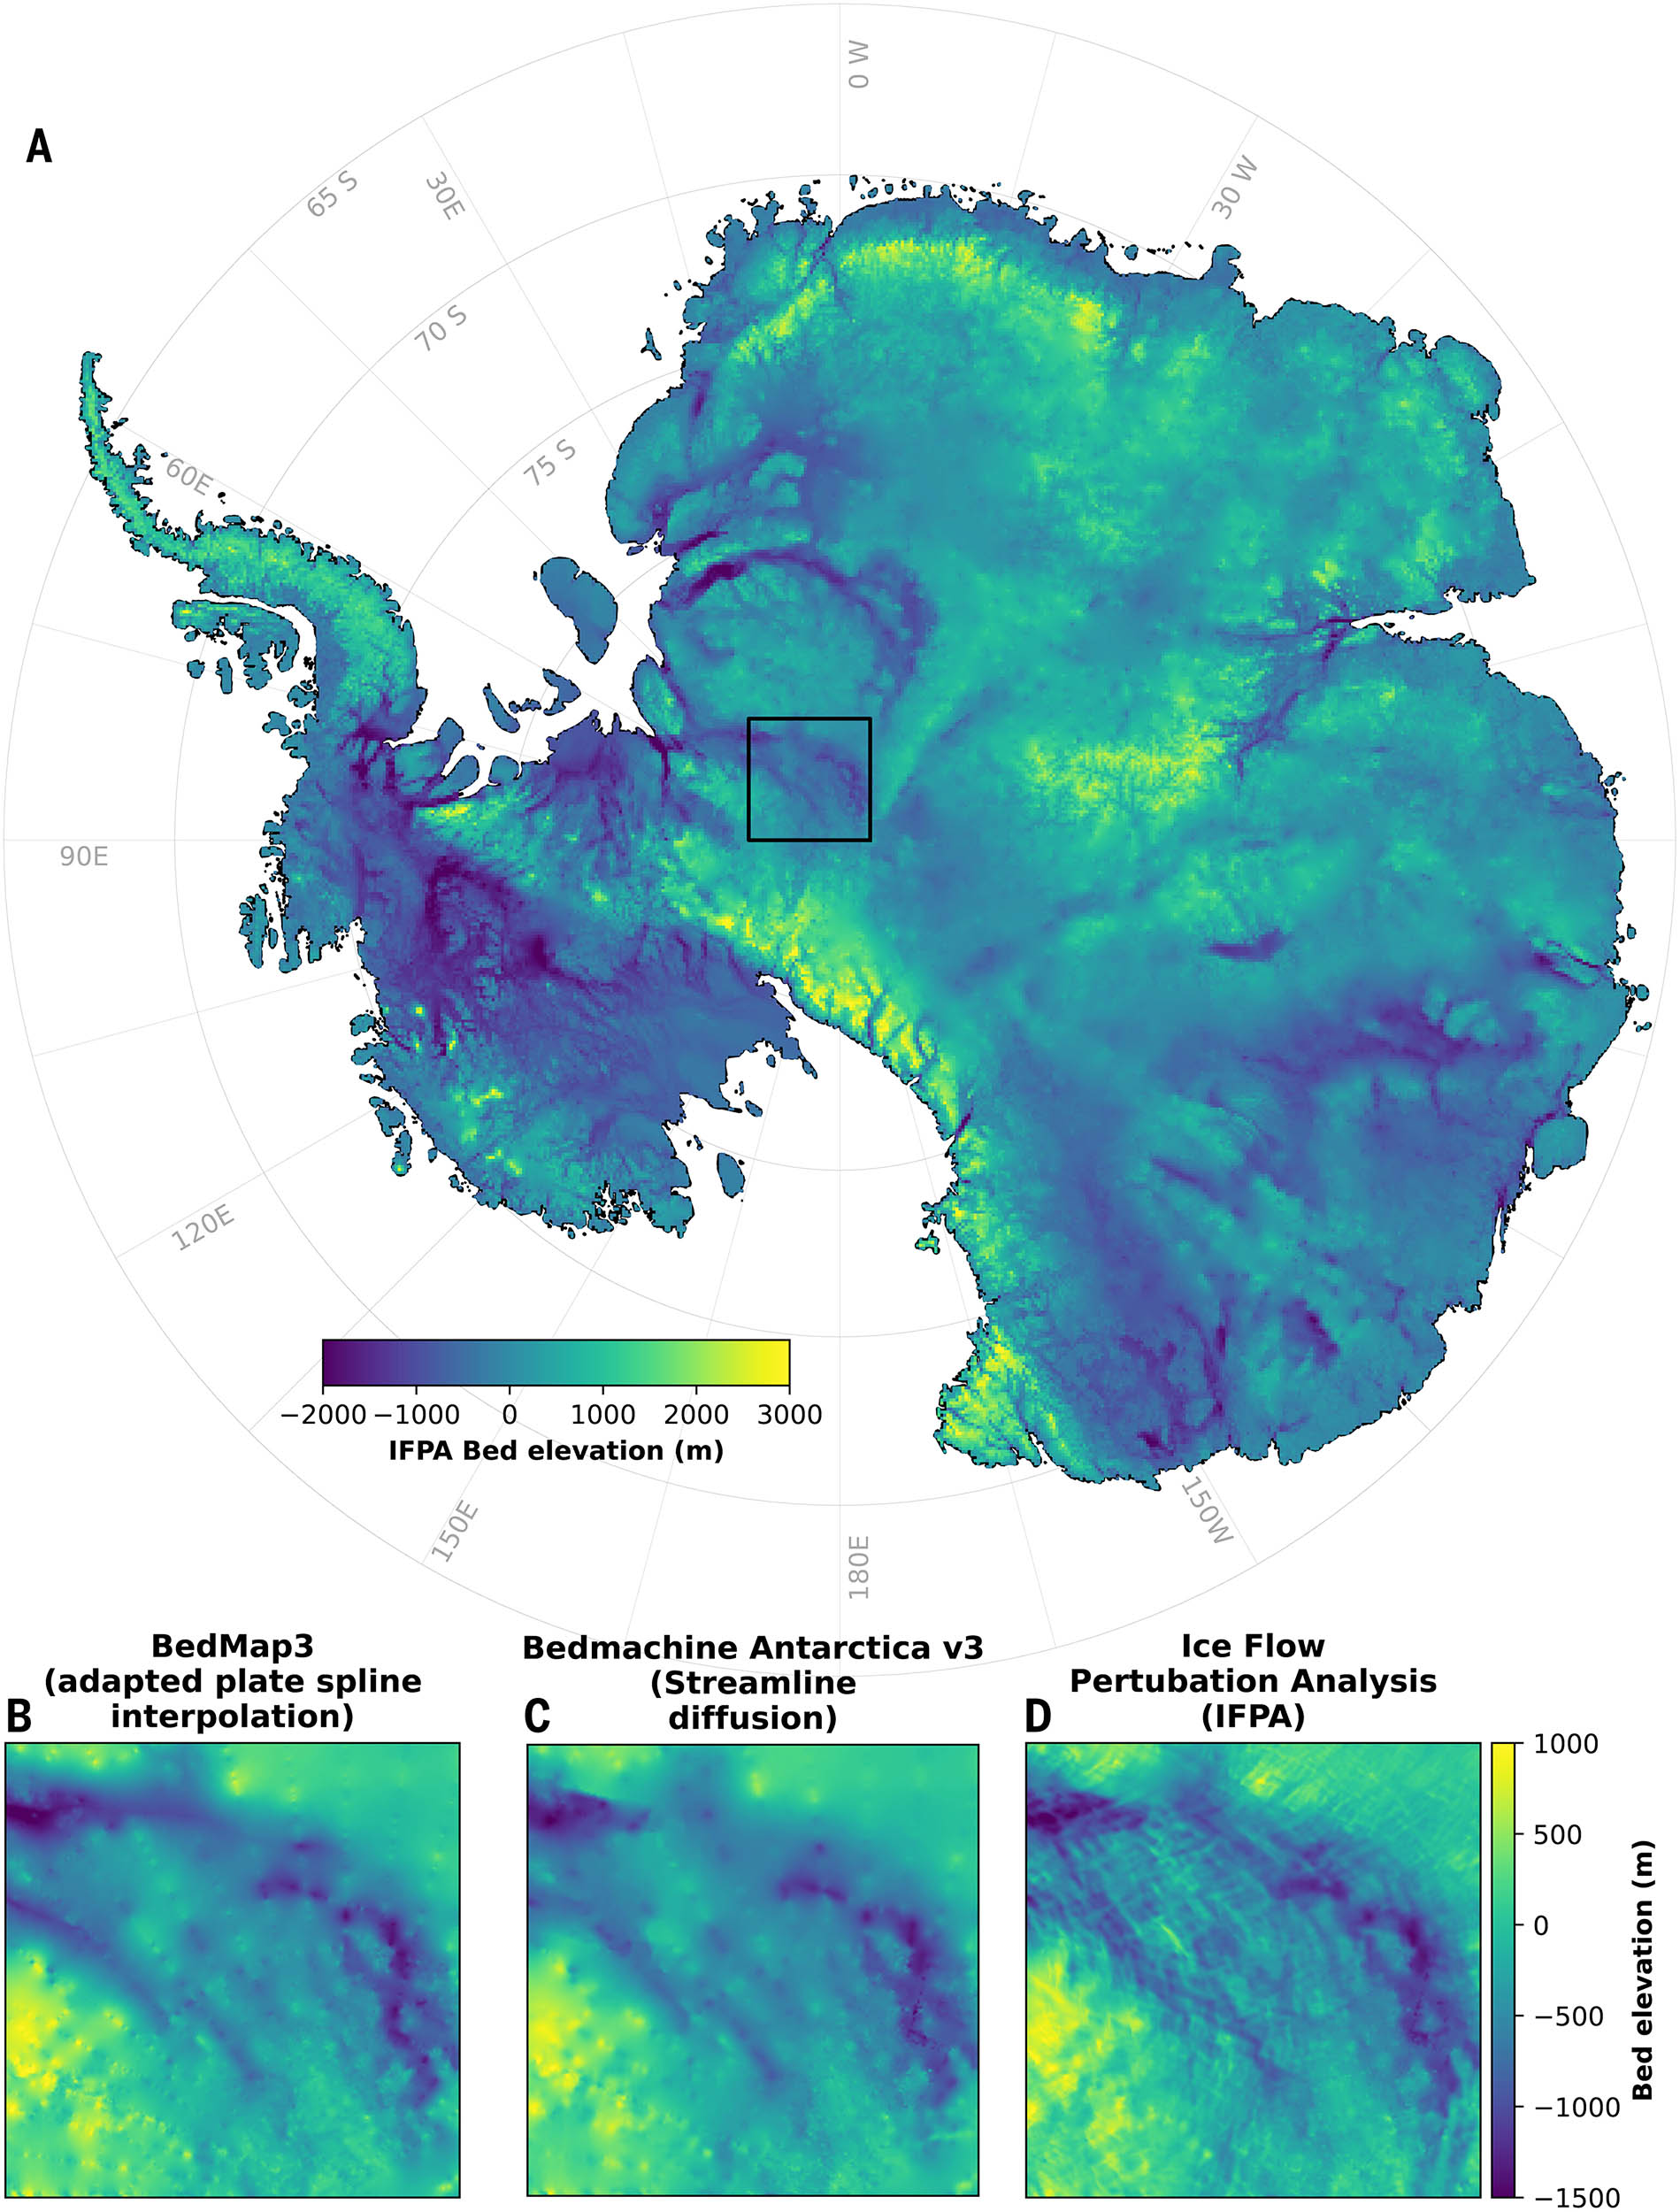
The research team combined high-resolution satellite measurements of the ice sheet surface, limited ice thickness data, and a technique called ice flow perturbation analysis.IFPA).
IFPA primarily relies on the physics of ice flow rather than relying on sparse aerial surveys. Subtle changes in the surface reveal how the ice is passing far below.
The importance of Antarctic landscapes
Antarctic ice sheet It’s not a static slab. It flows – and that flow primarily determines how much ice is carried to the coast, where it can thin and increase sea level rise.
In many regions, fast-moving ice streams act like drainage channels for vast areas of the continent.
The bedrock below is the primary control. Deep troughs can leak ice and promote faster flow. The ridge can deflect it. Basins can contain thick ice and change the shape of where ice accumulates or flows.
Layers also influence what happens at the ice-rock interface, where sliding, meltwater, and freezing processes can change the ease with which ice moves. If the bed is mapped too smoothly, the model may miss important paths or bottlenecks.
The problem is that direct measurements of Antarctic geological formations remain difficult. Radar and geophysical surveys cover large areas, but gaps remain and coverage is uneven.
As a result, some of the Earth’s most important features for sea level prediction remain only partially constrained.
Antarctic ice surface provides clues
IFPA works because the bed leaves a faint fingerprint on the ice above it. Thick ice weakens sharp features, so the surface does not reflect the bed.
But when the ice flows over a buried valley, canyonthe surface may sag slightly, the slope may change, or the speed may change by physically linking to the terrain below.
Satellites can detect these small signals on a large scale. This method combines surface height and motion with the dominant physics of ice flow to estimate bed topography over large areas where direct investigation is limited.
The goal is not to replace field data, but to connect field data and fill the spaces in between.
What the new map reveals
The authors report that their map resolves “medium-sized” features of approximately 2 to 30 kilometers in diameter.
This size range is the sweet spot. They are large enough to influence ice dynamics, but small enough that their size is often obscured by older products across continents.
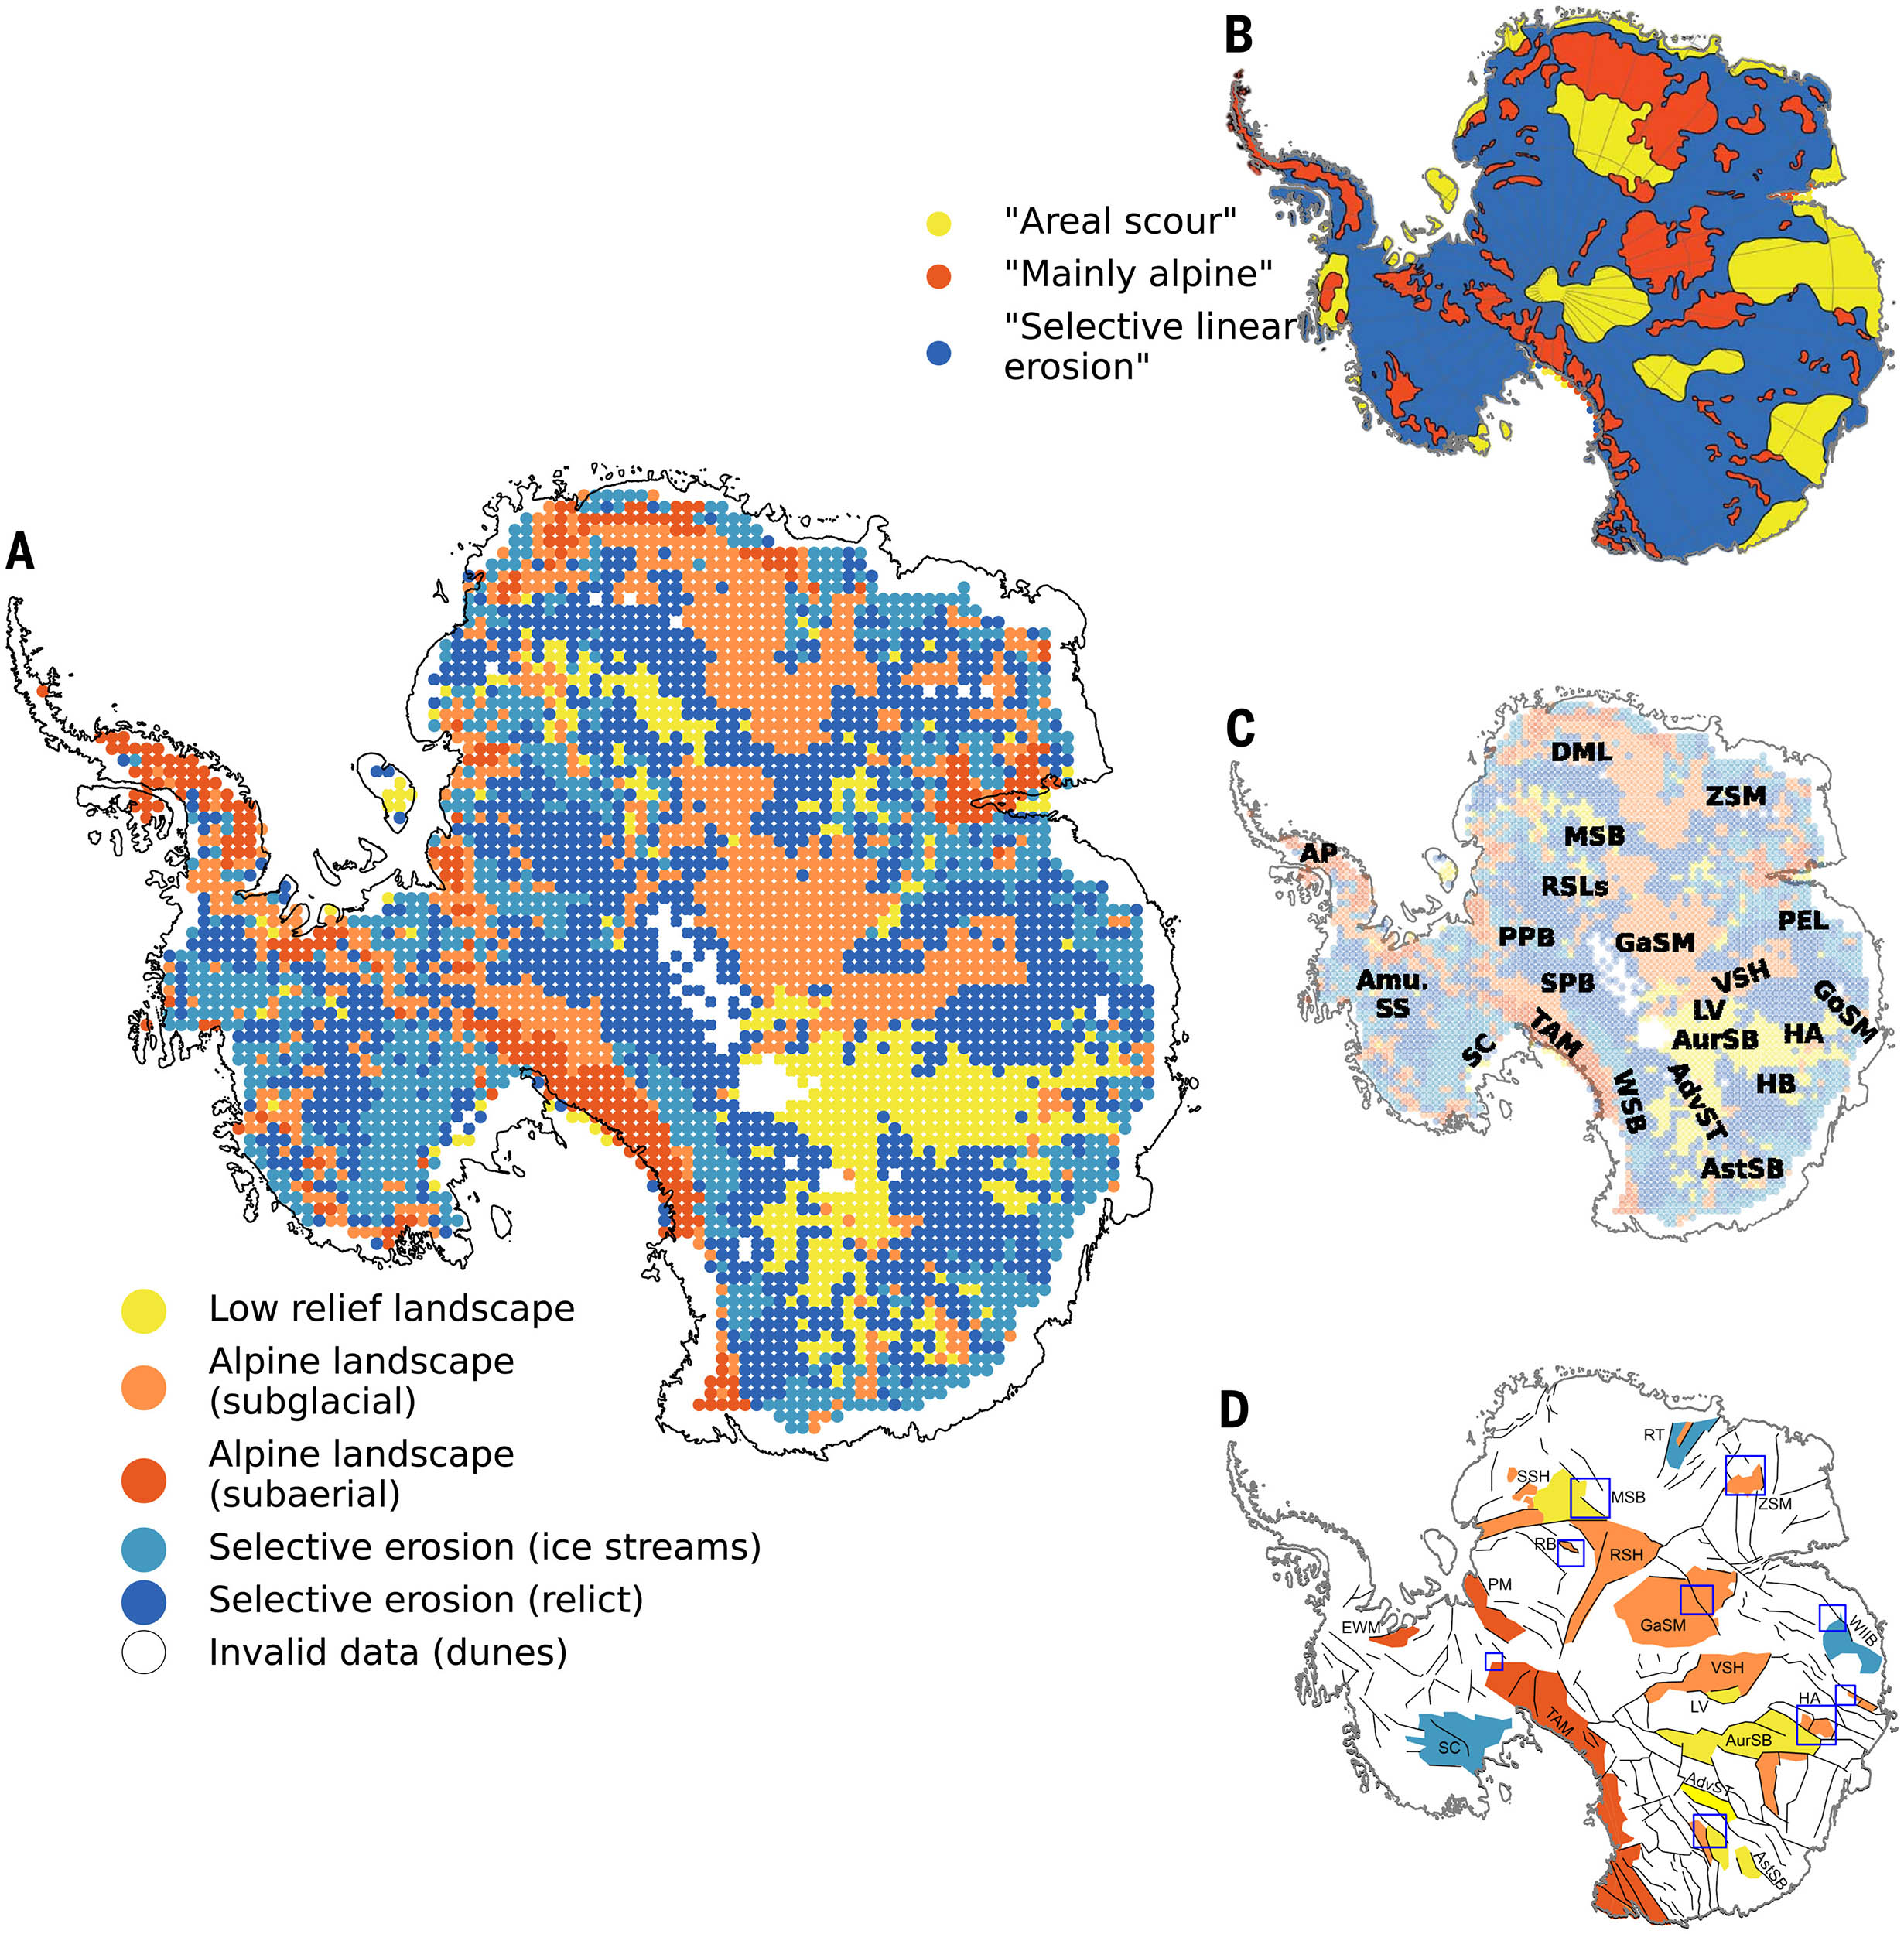
With this added detail, the reconstructed river bed shows deep, narrow alpine valleys, scoured lowlands, and extensive buried channels spanning hundreds of kilometers. Some of these may be relic landforms that predate modern ice sheets.
Were these landforms carved by rivers, or glacierThey still guide the ice and can shape where flows concentrate and how ice sheets respond to changing conditions.
very subtle signal
One thing to note is that the surface imprint of bed features can be very small. A canyon beneath several kilometers of ice may be nothing more than a small depression in the surface.
However, this approach can still pick up these effects if the measurements are accurate and the physics are carefully applied.
“Perhaps what is most surprising is that so many details of the topography, such as glacial valleys, hills and valleys, are so completely captured in the form of the ice surface so high up in the sky,” said co-author Robert Bingham, who lives in Edinburgh.
“Many changes at the surface are very subtle. When ice that is 3 km thick passes through a subglacial canyon that is perhaps 100 meters deep, the elevation of the ice surface typically drops by only a few meters, a change that is almost imperceptible when moving over the ice surface itself.”
Maps can be improved, but there are limits.
Even such detailed reconstructions are based on assumptions. Techniques for inferring layer shape from ice behavior require choices about how the ice deforms internally, how much the ice slips at the base, and the behavior of melting and freezing at the ice sheet interface.
These processes vary across Antarctica and remain difficult to observe everywhere.
“Although Ockenden et al. provide a moderately detailed map of Antarctic bedrock topography, it does not represent the final word on Antarctic geography,” said geophysicist Duncan Young. University of Texas at Austin In a related perspective.
“Similar to mass conservation methods, this analysis is based on key assumptions about mechanisms important to modeling ice sheet evolution, including ice deformation, basal slip, and melting and freezing processes at the ice-rock interface.”
Antarctica’s hidden landscape
In other words, this map should be treated as a major upgrade and guide. This can help identify where hidden valleys or channels may be shaping the flow, and can indicate where future models would be most improved with additional aircraft or ground surveys.
How Antarctica contributes to sea level rise will depend on how ice flows evolve as the climate warms and the oceans change.
Ice flow depends in part on the topography beneath the ice. A new map clarifies one of the most uncertain boundary conditions in ice sheet prediction by revealing mesoscale structures across Antarctica’s buried landscape.
With this clearer foundation, you can improve your current models and make future fieldwork smarter by showing you exactly where your next measurement will be most important.
The research will be published in a journal science.
—–
Like what you read? Subscribe to newsletter We bring you fascinating articles, exclusive content, and the latest updates.
Please check it out earth snapThis is a free app provided by. Eric Ralls and Earth.com.
—–